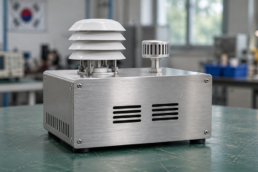
The bitsensing traffic radar project at Porta Nuova gives a road operator several ways to describe the same junction. A volume count can show how many vehicles passed. A turning count describes where traffic went, while a queue measure tells the operator about waiting traffic. Each measure needs a definition and a time window.
In October 2024, the Korean company reported installing and activating ten Traffic Insight Monitoring Sensors, or TIMOS, in Verona. It also said its TraXight software presented data from the system to city operators. The installation provides a case for examining how observations become measurements. A separate evaluation would establish whether traffic changed. bitsensing Verona installation announcement

bitsensing traffic radar starts with the road operator’s question
Consider an operator reviewing a busy junction after the morning peak. The first question may be about a particular approach. Did more vehicles arrive than usual, did a larger share turn in one direction, or did a queue remain after the peak? The answer depends on the measure and the period the operator examines.
This is the setting for roadside sensing. A fixed sensor observes a defined part of the road. Its observations can support measures used by a traffic operations team. The U.S. Federal Highway Administration’s Traffic Detector Handbook describes how different sensor types supply measures such as presence, volume and speed. FHWA Traffic Detector Handbook
There is also a distinction in where the equipment works. A vehicle’s onboard equipment serves the vehicle. A junction installation serves a road operator’s view of a location and period. Therefore, the two settings call for different descriptions of the data and the decision it supports.
Seoulz previously covered bitsensing in a roundup of autonomous vehicle startups. That article places the company among Korean mobility businesses working on sensing. The roadside products have their own deployment record and their own audience. Their operation starts with a question about the road. Seoulz on Korean autonomous vehicle startups

TIMOS provides the roadside sensing layer
bitsensing announced TIMOS in February 2023. The name stands for Traffic Insight Monitoring Sensor. In its product materials, the company describes a device combining radar, camera sensing and processing at the roadside. The software can use those observations to generate information about traffic. TIMOS launch announcement · bitsensing description of the sensor combination
Radar uses the return of radio waves to observe objects. Meanwhile, a camera supplies image information. Local processing means some computation takes place near the point of measurement. In a product that combines the two sensing methods, the traffic measure therefore depends on how the system interprets the observations together.
That arrangement also creates several points at which information can be checked. For example, a sensor can provide an observation, the processing can assign it to a traffic measure, and a later display can combine several measures. Each step needs a definition so the operator can trace a number back to its scope.
The company’s launch material describes functions such as average speed and queue length. These are statements about the product’s intended outputs. A road operator would then examine how a particular installation performs on the approaches and periods it needs to measure.
For example, an installation used for planning may need consistent daily totals. An operator handling a short disruption may need timely information in much shorter windows. Both can use roadside sensing, but their requirements for completeness and timing differ.

TraXight presents traffic monitoring data to operators
TraXight is the software companion to TIMOS. bitsensing describes it as a way to visualize and analyze the sensor data, including traffic statistics and diagnosis. ITS Korea’s international cooperation center also describes simulation-based signal optimization consulting among the platform’s stated functions. bitsensing TraXight description · ITS Korea project and product profile
Software helps make the measurements usable because it can organize them by approach and time. For example, an operator can examine a count over one period and compare it with the same period on another day. The comparison depends on whether both figures use the same location, interval and definition.
A dashboard also brings several measures together. It might show traffic volume beside a queue measure. The operator can then ask whether a rise in waiting traffic coincides with a rise in arrivals. The two readings are a starting point for investigating the cause.
Simulation is another step. A model can examine how traffic might behave under a specified scenario. Its conclusions depend on its inputs and assumptions. Therefore, a description of the software’s simulation capability establishes what kind of work it is intended to support. A field evaluation would answer what happened after a change was made.
This is also where responsibility moves from a product to an operating organization. The software presents measures and analysis. The road operator decides how to use them within its own procedures. For a project record, specify which party provided the data and who made the operating decision.

Traffic measurement starts with units and boundaries
Volume is the number of vehicles counted at a defined place during a defined period. A turning count further specifies the movement being counted. Speed describes how fast traffic is moving, while queue length describes the size of a waiting line. These measures can all change at the same junction.
The units make the differences visible. For example, a count over 15 minutes is a number of vehicles during that interval. Speed may be reported in kilometres per hour. Queue length can be expressed in vehicles or metres, depending on the study definition and collection method. FHWA field measurement of traffic measures
The definition also determines when a vehicle belongs to a queue. A study can specify what counts as waiting and the point at which a vehicle leaves the queue. Consequently, two displays labeled queue length can produce different values if their definitions or measurement intervals differ.
For example, consider a hypothetical junction carrying the same number of vehicles on two mornings. The share making one turn could change. A queue on that approach could then have a different length or duration. The volume total provides one part of the description.
Finally, retain the relevant location with the unit. An approach count, a junction total and a corridor measure cover different areas. A chart for a city team needs to say which one it shows before the figures can support a decision.

The Verona roadside sensing case has a dated record
South Korea’s Ministry of Land, Infrastructure and Transport named Verona among the overseas cities selected for its 2024 K-City Network solution demonstration project. The English announcement is dated April 18, 2024. This establishes the programme selection and its date. MOLIT demonstration selection announcement
Next came the installation record. bitsensing’s October release names the City of Verona and FAMAS SYSTEMS as partners. The company says the team installed ten TIMOS units and activated the project. The release identifies traffic volume, turning movements and queue length among the data supplied to the operator.
ITS Korea’s international cooperation center also records completion and activation in summer 2024. Its profile describes TIMOS and TraXight working together at Porta Nuova. The case profile provides a separate published record of the project and its intended use.
The ten-unit figure is a reported equipment count at a particular installation. It helps establish the scale of the work described. Separately, a performance figure would need its own unit, observation period and method. For example, a study of reduced delay would need observations before and after an identified change.
A project can therefore be described in stages. The ministry identifies selection, the company identifies installation and activation, and the project profile describes the combined product roles. The records give a dated account of the demonstration. An evaluation of changes in road conditions would require additional measurements.

Event traffic tests the continuity of traffic monitoring
A February 12, 2026 company article discusses Verona ahead of the Winter Olympics closing ceremony. It presents event traffic as a situation in which a city might need to measure changes in demand and traffic patterns. Its publication date places it before the ceremony. bitsensing’s February 2026 Verona commentary
The scenario matters because a measurement system faces different demands during a busy event. An operator might want to know whether comparable records were available throughout the period. The useful evidence would include which approaches were measured, when the records were complete and which intervals had gaps.
A city can also change how it manages traffic during an event. Road closures, diversions and travel schedules can shift demand. Therefore, a comparison with an ordinary day needs to identify these changes before it can explain why observed traffic differed.
The company’s blog discusses continuity in this setting. To evaluate it after the event, a reader would look for actual observations and defined test periods. The reviewed article supplies the company’s pre-event account. It contains no post-event measurements of uptime, counting error or changes in delay.
In June 2026, bitsensing again described TIMOS and TraXight as products for smart infrastructure. That continuing company description establishes its public positioning at the time. The specific evidence for Verona still comes from the dated project and measurement records. bitsensing’s June 2026 infrastructure article
Roadside sensing needs a defined comparison
An operator can start an evaluation by specifying the intended use. For example, a planning team may need vehicle counts by approach in comparable periods. A traffic operations team may care about the timing and completeness of reports over shorter periods. The question determines what should be measured.
Next, choose a reference observation for the same place and time. Independent counts can be compared with the system’s counts when the definitions and intervals align. The comparison should identify the coverage of each source and record periods in which either source has missing data.
Weather, light and vehicle mix can also affect the operating conditions. The FHWA handbook explains why sensor evaluation takes the application and field conditions into account. Its advice supplies general engineering context. Installation observations would then give the relevant results for TIMOS.
For example, a summary can separate ordinary and unusually busy periods. It can also identify the number of observations in each category. That makes it possible to see whether a result comes from a broad field test or from a small set of favorable intervals.
Finally, define what happens when the comparison cannot be made. An interval with no available record should have its own status. Recording it separately lets an operator assess data availability and measurement agreement as two related questions.

A traffic measurement example shows how errors cancel
Consider a hypothetical validation of one approach over two 15-minute intervals. A reference count records 100 vehicles in each interval. The system reports 104 during the first and 96 during the second. The figures here are invented for the arithmetic example.
First, subtract the reference count from the system count for each interval. The differences are positive four and negative four vehicles. Each therefore has an absolute difference of four. The comparison shows deviations in both intervals, in opposite directions.
Next, add the interval counts. The system and reference both total 200 vehicles. The difference over the full half hour is zero. An analyst who sees only that total will miss the two deviations that appear in the shorter windows.
The choice of summary depends on the use. For example, a monthly planning series and a 15-minute operating display need different detail. For an assessment, retain the interval definition, signed difference and absolute difference. Also keep the reference count visible so readers can interpret the size of an error.
A similar issue arises when measurements for several approaches are combined. Totals can agree while individual approaches differ. The example gives an operator a reason to request both the aggregate and the results for the periods or locations that matter to the intended use.
Availability is part of traffic monitoring performance
The usefulness of a traffic measure depends on when it is available. For example, a report that arrives later can still support a planning study. A team watching a live event needs to know when the observation was made and when it reached the display.
A useful operating record therefore distinguishes observation time from reporting time. It also identifies intervals with missing or incomplete inputs. A flat line on a graph may reflect a stable condition, while a gap means there is no comparable observation for the period.
Maintenance also belongs in that record. When equipment is serviced or a software version changes, an operator may want to check whether the definitions and results remain comparable. Keeping dates and version information helps explain a discontinuity in a series.
For example, an analyst comparing two weeks can ask how many expected intervals had valid data in each week. The answer gives a denominator for data availability. Next, the analyst can examine agreement with independent counts for the subset where comparisons are possible.
The same logic applies to a description of performance in rain or at night. Name the periods, sample size and definition used in the comparison. That gives a reader a way to understand which conditions were represented and which conditions would require more evidence.
A traffic monitoring pilot has a defined stage
In June 2025, bitsensing announced a memorandum of understanding with IKIO Technologies for traffic monitoring in India. The release describes a proposed implementation involving TIMOS and analytics. It is evidence of a partnership agreement and a stated plan at that date.
The company later included India among markets it described in its June 2026 smart-infrastructure article. That broad statement adds evidence about how bitsensing presents its reach. Project-specific questions still need records for the site, stage and reporting period in question.
For a road operator, a partnership announcement, equipment activation and routine service describe different milestones. For example, a demonstration can establish whether an organization can install and run a system at a site. A later operating record can show what the organization received over time.
Procurement also brings roles into view. A supplier provides a product. An integration partner can connect it to an operating environment. The road authority decides what it needs from the system. Naming those roles makes it easier to interpret a project announcement and locate the evidence for each milestone.
Seoulz’s robotaxi coverage offers context on Korean mobility deployment. The operating question here concerns a fixed junction and the traffic information its operator receives. The case therefore has its own records and evaluation criteria. Seoulz on Korea’s robotaxi services
Traffic measurement and outcome evaluation use separate records
A sensing system can supply the information used to make a change. The change itself belongs to the road operator’s record. For example, a study might identify a revised traffic plan, the dates when it applied and the parts of the network affected.
Then the evaluation would measure an outcome such as queue duration or delay with a consistent definition. A comparison should also account for other changes in the road environment. For example, construction, diversions and an event calendar can affect demand and the resulting delay.
Therefore, a before-and-after table should state the dates, conditions and observations behind the numbers. A comparable period can make the evidence clearer. A study covering several periods can then assess how consistently the result appears.
Safety outcomes require their own records and observation periods. A dashboard that reports traffic conditions can help identify a question for further study. A claim about changes in crashes needs evidence on those events and an analysis suited to the question.
Finally, identify which part of the evidence came from the sensor. If the system measures counts, cite the count validation. If a claim concerns a transport outcome, cite the analysis of that outcome. The relationship between the two can be explained once both sources are clear.
Read the bitsensing traffic radar record in order
Start with the product role. TIMOS supplies roadside observations and processing, while TraXight presents traffic measures for analysis. Next, identify the named location and the date of the project record. Verona’s selection and activation documents answer those initial questions.
For a measurement claim, look for the approach, interval, unit and reference observation. Those details explain what the sensor count represents. Also check for unavailable intervals and whether conditions in the study match the proposed use.
For an outcome claim, look for the operator’s action and a later evaluation. The dates and the comparison method matter because a road can change for several reasons at once. A dated installation report and a field evaluation can each be read on their own terms.
The Porta Nuova records show how a Korean sensor and analytics company entered a named city project. The next evidence a reader would need depends on the question. An operator assessing the counts needs a reference comparison. A city assessing a traffic change needs a measured outcome with the intervention and period attached.